The Role of Colours in Infographics
Colours and combinations of colours effectively convey a number of different messages. So using the right colours in your infographic is an effective way of sending stronger messages online. But before we look into the significance of infographics in the digital marketing world, let’s find out what infographics actually are.
It’s quite simple. Information graphics or ‘infographics;’ as they are called are graphic visual representations of information, data or knowledge intended to present complex information quickly and clearly. Data visualization, information design, and information architecture are the best use of infographics. – Wikipedia: http://en.wikipedia.org/wiki/Infographic
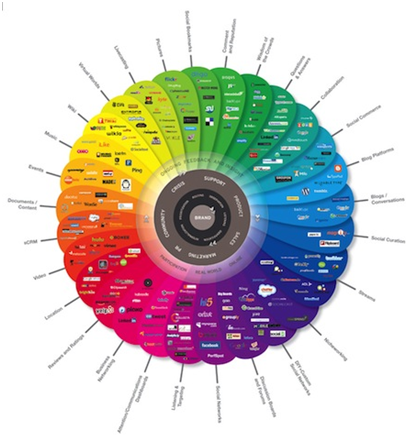
Using infographics is beneficial, as you can convey complex ideas or information using simple images and visual depictions that make it easy for users to understand better. It also saves a lot of time that gets spent in reading content heavy documents. Check this link for an example of an infographic that explains the conversation flow and channels between a brand and its customers.

Now that we have seen what an infographic is, let’s move on to understand the right choice of colours.
Colours and their effects on Consumers
Colour sentiment plays an important role on consumers’ psychology. So as an online marketer, you should carry out research, do variable testing on colour connotation, and try to find out which colours work best for your audience. The colours should be in line with the kind of information you’re including, or the brand/product/service you’re promoting.
A research related to colours of infographics has revealed the following colour sentiment among consumers.
Purple represents supremacy, wealth, royalty, dignity, status and power. While purple is often linked with creativity, I would personally associate creativity more with the colour Orange.
Blue is a widely accepted and used colour for identity, because of its relation with corporate culture. This colour is also associated with trust, productivity, depth, and tranquillity.
Green usually represents nature and organic materials. It is also associated with safety, wealth, progress, youth, and harmony. Green also indicates jealousy or envy.
Yellow is a symbol of joy, energy, and liveliness. Yellow is ideal to draw the attention of shoppers in the minimum possible time. You can make your website a little more cheerful by adding Yellow; but be careful because if overused, it can be quite hard on the eyes.
Orange represents joy, aggression, warmth, ambition, energy, creativity, and enthusiasm. It is a good choice of colour for a call-to-action. It can effectively draw a customer’s attention.
Red is the colour of intention, and universally accepted for love and life. This colour also refers to a sense of emergency (SOS), and a warning signal.
Pink is the colour attributed to love, romance, and tenderness. It is a feminine colour and has a calming effect on viewers. This colour is usually used for products meant for females or young girls.
Brown stands for confidence and dependability and is used to represent conventional and sophisticated objects.
Black is a colour associated with mystery, sophistication, and elegance.
Impact of Infographics on the Marketing Strategy
While creating presentations, annual reports, research documents, blogs, newsletters, etc. you can effectively use infographics. It will help you to keep people/customers interested because the visual elements can be understood at a glance. Since consumers want numbers and statistics to back the information they read, including infographics in your digital marketing strategy is a great idea!
- Infographics are image-based and can grab attention of the audience, where blogs, articles, and other text might be a little less effective.
- Infographics, owing to their increased share ability as compared to text; can be excellent branding vehicles. Just include a logo with your other information, and that’s it!
- Information-rich infographics that have been branded well are the right step forward if you are looking at being perceived as a thought leader in your industry or domain.
Tips to Remember While Creating an Infographic
- Make sure your research, facts, statistics, etc. are from trusted, reputed sources. Always credit the source.
- Write out the text supporting your statistics in crisp, short sentences that will not make the infographic very content heavy.
- Use an appropriate colour/colour scheme e.g. an infographic on how women use social media could have more hues of pink, an infographic on digital marketing in the banking sector could have shades of green and grey (to denote money or profit), etc.
- Use call-to-actions wherever appropriate
- Maintain relevancy
Now that you know what an infographic is, the role of colours while designing one, the effectiveness of infographics in a digital marketing strategy, the best practices to create an infographic; it’s a good time to make an infographic of your own! And don’t worry if you’re not too good with designing or haven’t hired a social media agency. You can still create the infographic with the help of websites like Gapminder, HoHli, Visual.li and Daytum.
So what is your infographic going to be about?


what do you think?