‘Graph’ically Yours… A look at the new Facebook insights
‘Change is never easy, you fight to hold on and you fight to let go’ – The Wonder Years.
It’s true, isn’t it? We are always hesitant to change. And still, history is witness to a lot of huge changes over the years. We make changes every day; after all, it’s these changes and choices we make that make us who we are. Working in a social media agency, you realize the dynamic nature of change, with constant updates popping up from every direction. You adapt to it and move on with the rest of your day. But when Facebook launched its new insights we didn’t know what to expect. However this is one change that I quite like.
The old Facebook insights were simply put quite dated. While the raw data provided is still the same. The illustrated data in the form of graphs has made a quite an impression on me. From the overview to the in-depth analysis, the graphs of the new Facebook insights are vivid, dynamic, and constantly changing according to your mouse over to give you more details.
And without further ado, let’s take a look at what they look like:
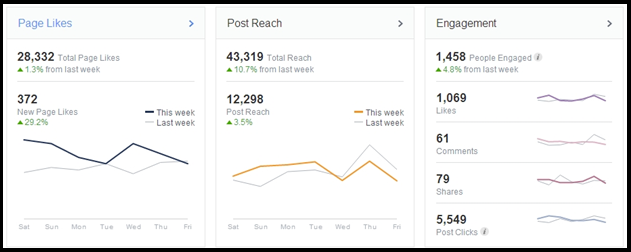
The overview keeps it simple. Tells you the basics like the likes on the page, the rate at which they have increased, the change in reach over the week, and the kind of engagement you had over the week. The next section shows you the engagement of your last 5 posts, with an option to boost them (paid promotion) and also to view more posts.
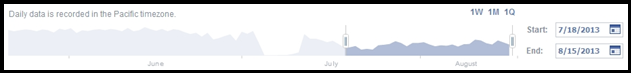
The next section talks about the page, an added benefit here is the month selection slider. With this you can easily switch between months.
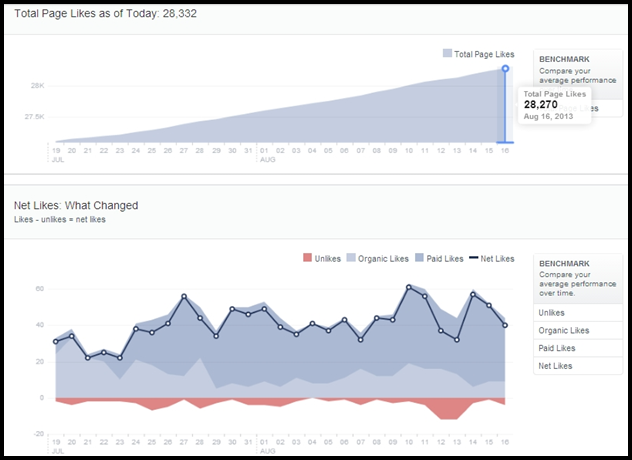
This next section talks about the likes and the changes in the likes the page has received and also segregation between the likes you get. You can use it to understand whether they were attained through a paid campaign or organically; finishing off with the net Likes and Unlikes on the page.
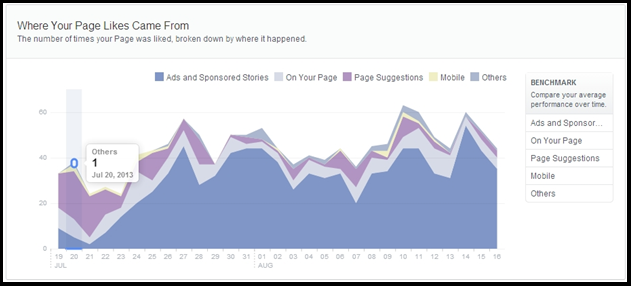
Another graph that has drastically improved over the previous edition is the ‘Where your Page Likes came from’ graph. While the older version just had a very basic / boring graph, the new improved version is vibrant and dynamic as you can see below.

Moving on to the next chapter, here is where the dreams of everyone who has worked in a social media agency come true. The graphical representation of when your fans are actually online (on the pages fans I mean). And this is something I have tried out myself. Based on this graph, I scheduled my posting to the times when most of my page fans were online; and yes, it does help to quite an extent. This is what your guardian angel looks like.

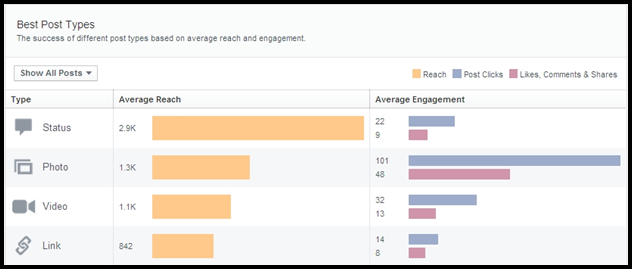
And for those wondering what posts work for your page and what don’t; here is a little something for you!
The rest is quite the same as it was before with mostly just minor facelifts and few tweaks here and there.
Working with a digital marketing company, you are often going through insights; and over a period of time, get accustomed to one type. You don’t really want to change to a newer look and feel. But trust me on this, if you are one of the lucky ones who has the new look for the Facebook insights, keep it… this one’s here to stay!
what do you think?